Walkability refers to how far walking is enabled and encouraged as an activity that is safe, continuous, easy to access, and enjoyable for everyday users (Transport for London, 2004:5). A genuinely walkable neighborhood is also characterized by qualities such as clarity in wayfinding (legibility), physical ease and comfort, practical convenience, personal safety, and inclusive environments shaped by universal design (NZ Transport Agency, 2009). The level of walkability is shaped in nearly equal measure by personal characteristics, social-context conditions, and features of the physical environment (Giles-Corti and Donovan, 2003). Because of this, the planning and design decisions embedded in the built environment strongly affect whether people decide to walk within and through a neighborhood. A substantial body of prior research has therefore concentrated on neighborhood planning attributes, largely because these can be quantified in an objective manner and are often obtainable through secondary datasets at broad spatial scales (Clifton, et al., 2007; Sallis, 2009). The incorporation of geographic information systems (GIS) has further expanded the ability to evaluate neighborhood form objectively, offering a faster and less resource-intensive approach that can describe large areas and can also support proposed design interventions (Parks and Schofer, 2006).
In the planning literature, four parameters are repeatedly linked with neighborhood walkability: population density, access to destinations, network connectivity, and land-use mix (Lee, et al., 2018). Greater residential density generally means more people are present in public space, producing livelier streets, stronger informal oversight of the public realm, improved perceived security, and better conditions for neighborhood businesses. It also tends to place more residents within reasonable reach of transit, thereby increasing the likelihood of walking and public transport use (Ewing, 2000). Accessibility—defined as the ease of reaching a destination based on spatial distance (Talen, 2002)—also influences how residents choose to travel. What counts as an “acceptable” walking distance varies with trip purpose, climate and weather, terrain, and other contextual factors; however, a quarter-mile is commonly cited as a comfortable distance for routine local access to community amenities, parks, and similar destinations (NZ Transport Agency, 2009). Street-network connectivity supports more direct travel paths for both pedestrians and vehicles, improving navigation and often encouraging walking and cycling. Yet, if connectivity is excessive and poorly used, it may create opportunities for anti-social activity—such as burglary—by offering convenient escape routes with limited informal supervision (Hillier and Sahbaz, 2008; Sohn, et al., 2018; White, 1990). Features like short blocks and frequent intersections provide multiple route options, make walking experiences more varied, and can reduce the perceived duration of a trip (Ewing, 2000). Similarly, mixed land use draws different users at different times for varied purposes, supporting an active public realm and strengthening personal security through natural surveillance (Lee, et al., 2018; Tibbalds, 2005).
To identify how the built environment most decisively shapes walkability, researchers have applied a wide range of approaches and analytical strategies (Singhal, 2018a). Many investigations examine neighborhood variables—alone or in combination—using objective indicators drawn from secondary sources, then verify or enrich those findings through subjective measures such as residents’ perceptions, feedback instruments, and remote assessment techniques. In research focused on the Portland metropolitan area, Lund (2003) supported the new urbanist proposition that locating amenities like parks and retail within walking distance of homes can increase walking. At the same time, the findings strongly suggested that influences beyond design—especially individual attitudes—also play an important role and should be incorporated into future debates and research. In another study involving 23 neighborhoods in the Chicago metropolitan region, Parks and Schofer (2006) developed objective indicators based on reliable secondary datasets and showed that these aligned well with established subjective measures. Their work used remotely sourced information to assess nine variables grouped into three primary categories of pedestrian-related attributes: network configuration, pedestrian infrastructure, and the adjacent roadside built environment.
Lee, et al. (2007) investigated how residents’ views of neighborhood conditions corresponded with actual time spent walking in objectively different areas of Japan, using questionnaire responses from 432 participants. Areas with higher density, greater land-use diversity, and stronger connectivity were viewed as more walkable and were associated with longer walking times. This outcome implied that the physical characteristics of neighborhoods might, in some cases, reduce reliance on perception-based measures in later studies. Lee and Moudon (2008) also explored how neighborhood form in Seattle related to physical activity—particularly walking and cycling—by combining self-reported survey data with GIS-based objective measures. Barton, et al. (2012) highlighted the central role of proximity to local facilities in shaping travel choices across different social groups, concluding that providing destinations within walkable distance can increase physical activity and lessen dependence on private cars. Leslie, et al. (2005), using a revised version of the Neighborhood Environment Walkability Scale (NEWS) originally developed by Saelens and Sallis (2002), compared how residents perceived two Adelaide neighborhoods—one objectively high in walkability and the other low—selected using GIS-derived indicators such as intersection density, dwelling density, and land-use mix. They found that participants’ perceptions generally corresponded with the objectively measured walkability of their neighborhoods. Pentella (2009) examined how socioeconomic status (SES) related to walkability at both neighborhood and street scales, using GIS to assess neighborhood-level measures including residential density, transit density, connectivity, crime density, and land-use mix. The analysis found no meaningful association between neighborhood walkability and SES, though the strength of the conclusions was limited by the small sample and by observation-related subjectivity. Taken together, these studies indicate that objective metrics can cost-effectively improve understanding of macro-scale environmental conditions and related issues, while also making replication more practical than approaches that depend primarily on residents’ perceptions.
While defining the study areas, two common approaches from earlier research were considered: (i) drawing study boundaries around a single destination (e.g., a school) or a cluster of destinations (e.g., a commercial node), and (ii) selecting neighborhoods that follow administrative or comparable formal boundaries. The second approach was adopted, as administratively defined neighborhoods were expected to show greater internal consistency in built character and to allow easier access to relevant data.
Amritsar, whose urban history extends back to the sixteenth century, has evolved through successive phases of growth that produced distinct neighborhood typologies and uneven density patterns. Consequently, the city’s gross population density of approximately 73 persons per hectare (pph) is not evenly distributed. The walled city area is characterized by very high densities (\(> 320\) pph) that may reach about 710 pph, whereas the areas outside the walls are more commonly marked by medium (120–300 pph) to low (\(< 120\) pph) densities (SAI Consulting Engineers, 2010). The author selected a total of 14 neighborhoods across these three density bands (high, medium, low), with boundaries demarcated using maps from the Google Maps mapping service (Table 1). Two neighborhoods—Katra Karam Singh (N-1) and Bagh Ramanand (N-2)—were chosen to represent the high-density conditions of the walled city. Because the area outside the walled city exhibits substantial variation in physical character, additional case neighborhoods from that zone were included. Holy City (N-14), an emerging residential development that consolidated 12 licensed colonies (land parcels formally approved for residential development), was also included because it typified many similar projects; its boundary was delineated using a proposed layout plan that integrated the 12 colonies into a single study unit.
| Code | Neighborhood | Density zone | Approx. density (pph) |
|---|---|---|---|
| N-1 | Katra Karam Singh | High (\(>320\)) | 680 |
| N-2 | Bagh Ramanand | High (\(>320\)) | 640 |
| N-3 | Ram Bagh Extension | Medium (120–300) | 280 |
| N-4 | Ranjit Avenue | Medium (120–300) | 260 |
| N-5 | Green Avenue | Medium (120–300) | 240 |
| N-6 | Majitha Road Belt | Medium (120–300) | 210 |
| N-7 | Putlighar | Medium (120–300) | 190 |
| N-8 | Verka Fringe | Medium (120–300) | 170 |
| N-9 | Mall Road Corridor | Medium (120–300) | 150 |
| N-10 | Batala Road Pocket | Medium (120–300) | 130 |
| N-11 | Chheharta | Low (\(<120\)) | 110 |
| N-12 | Manawala | Low (\(<120\)) | 95 |
| N-13 | Vallah | Low (\(<120\)) | 80 |
| N-14 | Holy City | Low (\(<120\)) | 70 |
Although the population-density classification for the neighborhoods followed the draft master plan for Amritsar (SAI Consulting Engineers, 2010), data for the accessibility and connectivity parameters were obtained using imagery from the Google Earth mapping service. These inputs were used to develop the respective indices and classifications.
In the planning literature, accessibility commonly refers to distance to key pedestrian destinations associated with work, transit, shopping, and recreation. In the present study, accessibility was restricted to walking proximity to parks and playgrounds. Access to nearby green spaces has been reported to be positively associated with recreational walking initiatives (Zainol, et al., 2017). The draft master plan for Amritsar notes a general shortage of large parks, indicating that recreational land use comprises only about 1.6% of the developed area, compared with a prescribed benchmark of 20–25% (SAI Consulting Engineers, 2010). Accordingly, all parks and playgrounds, irrespective of size, were included in the accessibility calculation.
A distance of one-tenth mile was used as the proximity threshold, even though neighborhood-park accessibility is often assessed using a one-quarter-mile distance in the planning literature. The one-tenth-mile radius was measured from the centroid of any park located within the neighborhood boundary (parks outside the boundary were not used for that neighborhood). Parks and playgrounds were identified using Google Earth imagery and then cross-checked through on-ground verification. Figure 1 illustrates the procedure used to determine neighborhood accessibility to parks and playgrounds. The accessibility score for each neighborhood was computed as the percentage of neighborhood area falling within the accessible range: \[\text{Neighborhood accessibility} = \frac{\text{Total neighborhood area within } \tfrac{1}{10}\text{ mile of the centroid of a park or playground}} {\text{Gross neighborhood area}} \times 100.\]
Connectivity was operationalized through intersection density, which reflects the ease with which pedestrians can move through the street network to reach destinations within the neighborhood. Three- and four-way intersections typically indicate closer spacing of routes and multiple path choices, whereas dead ends often discourage pedestrian movement. For this reason, intersection density was used as an indicator of neighborhood connectivity and, by extension, walkability. The author manually counted intersections in each study neighborhood using Google Earth imagery (Figure 1).
Because there is no single absolute ideal value, connectivity was computed on a relative basis by normalizing each neighborhood’s intersection density against the maximum observed in the study set: \[\text{Neighborhood connectivity} = \frac{\text{Intersection density of neighborhood}} {\text{Maximum intersection density observed in any study neighborhood}} \times 100,\] where the intersection density of a neighborhood was defined as the density of three- and four-way junctions minus the density of dead ends.
Walkability is frequently treated as an outcome shaped by individual perceptions. To capture pedestrians’ views, the author conducted surveys within each selected neighborhood. Randomly selected resident respondents—diverse in gender, age, income, and vehicle ownership—were interviewed by trained architecture students regarding their walkability perceptions.
Perceived walkability was recorded using two questions on a five-point Likert scale. First, respondents indicated their preference for walking over driving, with response options ranging from “almost every time” to “never.” Second, they rated the pedestrian environment in their neighborhood from “very good” to “very bad.” A total of 224 responses were collected, with neighborhood-level sample sizes ranging from 14 to 19 respondents. Sample sizes were intentionally kept small because the author expected they would still yield reasonable accuracy within time and cost constraints. The responses were aggregated for the city and then analyzed and interpreted across categories of population density, accessibility, and connectivity.
Most respondents (57.0%) were male, nearly half (49.0%) were aged 31–50 years, and 48.5% reported monthly household incomes in the range of 12,000–55,000 Indian rupees (INR) (1 INR = 0.012 USD). Motorized vehicle ownership was widespread: two-wheelers were the most commonly owned (77.5%), followed by cars, jeeps, and similar vehicles (66.0%), noting that some respondents owned more than one vehicle type. Table 2 summarizes the respondents’ socioeconomic profile.
| Variable | Category | Count | Percent (%) |
|---|---|---|---|
| Gender | Male | 128 | 57.1 |
| Female | 96 | 42.9 | |
| Age group (years) | 18–30 | 49 | 21.9 |
| 31–50 | 110 | 49.1 | |
| 51+ | 65 | 29.0 | |
| Monthly household income (INR) | \(<12{,}000\) | 40 | 17.9 |
| \(12{,}000\)–\(55{,}000\) | 109 | 48.7 | |
| \(>55{,}000\) | 75 | 33.5 | |
| Vehicle ownership\(^\dagger\) | Two-wheeler (scooter/motorcycle) | 174 | 77.7 |
| Car/jeep (and similar) | 148 | 66.1 | |
| Bicycle | 28 | 12.5 | |
| None | 14 | 6.3 |
\(^\dagger\)Multiple responses were allowed; percentages are calculated using \(n=224\) as the denominator.
A chi-square test was used to assess whether participants’ responses
to the two perception questions were associated with the three
neighborhood-planning variables of population density, accessibility,
and connectivity. Cross-tabulation analysis was then performed to
further examine the strength and direction of any associations.
Statistical analyses were conducted using Microsoft Excel and IBM SPSS
Statistics for Windows, Version 21
(www.ibm.com/products/spss-statistics).
A total of 224 valid questionnaires were analyzed across 14 neighborhoods. Responses were examined citywide and then compared across neighborhood classes of population density, accessibility (park/playground proximity), and street-network connectivity. Perceived walkability was captured using two Likert-type questions: (i) preference for walking over driving and (ii) overall rating of the neighborhood pedestrian environment.
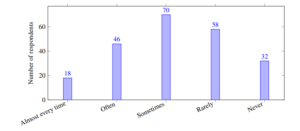
Citywide distributions for the two perception items are summarized in Table 3. For walking preference, the modal response was sometimes, followed by rarely. For pedestrian-environment quality, most responses clustered around average, with a comparable share expressing negative assessments (bad or very bad).
| Item / response option | Count | Percent (%) |
|---|---|---|
| Preference for walking over driving | ||
| Almost every time | 18 | 8.0 |
| Often | 46 | 20.5 |
| Sometimes | 70 | 31.3 |
| Rarely | 58 | 25.9 |
| Never | 32 | 14.3 |
| Rating of neighborhood pedestrian environment | ||
| Very good | 22 | 9.8 |
| Good | 54 | 24.1 |
| Average | 78 | 34.8 |
| Bad | 48 | 21.4 |
| Very bad | 22 | 9.8 |
Figure 1 visualizes the distribution of walking-preference responses, highlighting the dominance of mid-range choices and the non-trivial share of respondents who reported rarely or never choosing to walk.
To examine how residents’ perceptions differed by urban form, the walking-preference responses were grouped into three bands: high preference (almost every time/often), neutral (sometimes), and low preference (rarely/never). Table 4 indicates that higher-density neighborhoods had a larger proportion of respondents reporting a higher inclination to walk, whereas low-density neighborhoods showed a clear shift toward low walking preference.
| Population density class | High preference | Neutral | Low preference |
|---|---|---|---|
| High (\(>320\) pph) (\(n=34\)) | 16 | 10 | 8 |
| Medium (120–300 pph) (\(n=126\)) | 56 | 40 | 30 |
| Low (\(<120\) pph) (\(n=64\)) | 8 | 20 | 36 |
| Total (\(n=224\)) | 80 | 70 | 74 |
These patterns suggest that compact contexts may support a greater tendency to walk; however, density alone does not fully determine behavior, since a considerable share of respondents in medium-density neighborhoods still reported neutral-to-low walking preference.
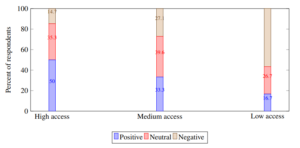
Pedestrian-environment ratings were similarly consolidated into three categories: positive (very good/good), neutral (average), and negative (bad/very bad). Table 5 shows a pronounced gradient by accessibility class: neighborhoods with higher shares of area within walking proximity to parks/playgrounds had substantially more positive environment ratings and fewer negative ratings. In contrast, low-accessibility neighborhoods exhibited the highest negative share.
| Accessibility class | Positive | Neutral | Negative |
|---|---|---|---|
| High (\(>50\%\) area accessible) (\(n=68\)) | 34 | 24 | 10 |
| Medium (25–50%) (\(n=96\)) | 32 | 38 | 26 |
| Low (\(<25\%\)) (\(n=60\)) | 10 | 16 | 34 |
| Total (\(n=224\)) | 76 | 78 | 70 |
Connectivity also exhibited clear differences, though the separation was less steep than for accessibility. Table 6 indicates that high-connectivity neighborhoods were rated more positively overall, while low-connectivity neighborhoods concentrated more negative responses.
| Connectivity class | Positive | Neutral | Negative |
|---|---|---|---|
| High (\(>70\)) (\(n=90\)) | 38 | 34 | 18 |
| Medium (40–70) (\(n=94\)) | 30 | 36 | 28 |
| Low (\(<40\)) (\(n=40\)) | 8 | 8 | 24 |
| Total (\(n=224\)) | 76 | 78 | 70 |
Figure 2 provides a compact visualization of how pedestrian-environment ratings shift as accessibility improves, showing the growing share of positive ratings and the corresponding reduction in negative ratings.
To connect subjective outcomes with measured planning indices, Table 7 summarizes neighborhood-level density, accessibility, connectivity, and mean perception scores. Mean scores were computed on 1–5 scales, where higher values represent stronger walking preference and better pedestrian-environment ratings. Across neighborhoods, higher accessibility and connectivity tended to coincide with higher mean pedestrian-environment ratings, while the association with walking preference was weaker and more context-dependent.
| Code | Density (pph) | Accessibility (%) | Connectivity (0–100) | Mean walk pref. | Mean env. rating |
|---|---|---|---|---|---|
| N-1 | 680 | 62 | 84 | 3.7 | 3.9 |
| N-2 | 640 | 58 | 80 | 3.5 | 3.7 |
| N-3 | 280 | 49 | 71 | 3.3 | 3.4 |
| N-4 | 260 | 46 | 68 | 3.2 | 3.3 |
| N-5 | 240 | 41 | 64 | 3.1 | 3.2 |
| N-6 | 210 | 37 | 60 | 3.0 | 3.1 |
| N-7 | 190 | 33 | 55 | 2.9 | 3.0 |
| N-8 | 170 | 29 | 52 | 2.8 | 2.9 |
| N-9 | 150 | 27 | 48 | 2.8 | 2.8 |
| N-10 | 130 | 24 | 45 | 2.7 | 2.7 |
| N-11 | 110 | 22 | 41 | 2.6 | 2.6 |
| N-12 | 95 | 18 | 38 | 2.5 | 2.4 |
| N-13 | 80 | 15 | 34 | 2.4 | 2.3 |
| N-14 | 70 | 14 | 30 | 2.3 | 2.2 |
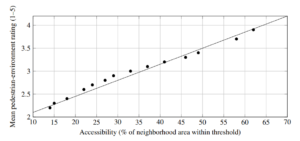
Figure 3 illustrates the neighborhood-level relationship between accessibility and mean pedestrian-environment rating, showing a clear upward trend: neighborhoods with greater park/playground proximity tended to receive better pedestrian-environment evaluations.
Chi-square tests were used to examine whether the two perception items were associated with the three planning variables. Table 8 summarizes the test statistics. The results indicate that perceived pedestrian-environment quality was significantly associated with accessibility and connectivity, and also showed a significant association with population density. Walking preference exhibited a statistically significant association with density and accessibility, while its relationship with connectivity was not statistically significant at the conventional 5% level.
| Perception item | Planning variable | \({\chi^2}\) | df | \(p\)-value |
|---|---|---|---|---|
| Walking preference | Population density | 9.84 | 4 | 0.043 |
| Walking preference | Accessibility | 18.92 | 4 | 0.001 |
| Walking preference | Connectivity | 7.11 | 4 | 0.130 |
| Pedestrian-env. rating | Population density | 12.76 | 4 | 0.013 |
| Pedestrian-env. rating | Accessibility | 32.55 | 4 | \(<0.001\) |
| Pedestrian-env. rating | Connectivity | 14.88 | 4 | 0.005 |
Overall, the findings indicate that proximity to parks/playgrounds (accessibility) shows the most consistent relationship with perceived walkability outcomes, particularly with evaluations of pedestrian-environment quality. Connectivity also relates meaningfully to perceived environment quality, although its direct association with stated walking preference is weaker. Population density demonstrates an association with both perception items, suggesting that compact urban structure may support walkability perceptions, but the presence and quality of destinations and network conditions remain critical in explaining differences across neighborhoods.
This research was motivated by widely cited arguments in walkability scholarship suggesting that key neighborhood-planning attributes—notably population density, proximity to everyday facilities, and street-network connectivity—shape residents’ willingness to walk and their assessment of local pedestrian conditions. Using Amritsar as a case setting, the study tested these propositions across neighborhoods that differ substantially in urban form and development context, and it clarified how far residents’ reported walkability perceptions align with objectively derived planning measures.
Methodologically, the study relied on administratively delineated neighborhoods to maintain a reasonable degree of internal consistency in built character and to ensure practical access to spatial information. Population density classes were based on the city’s planning framework, whereas accessibility and connectivity were calculated objectively using Google Earth imagery supported by on-ground verification. The neighborhoods were then organized into three classes (high/medium/low) for each planning variable, allowing the perception survey to be interpreted in relation to these categories. The pedestrian survey captured two complementary outcomes: (i) residents’ preference for walking over driving and (ii) their overall evaluation of the neighborhood pedestrian environment. The respondent pool reflected a range of socioeconomic and demographic conditions and displayed widespread motorized vehicle ownership, which is particularly important when interpreting stated walking preference in a context where private mobility is common.
The results provide two central insights. First, the strongest and most consistent relationships emerged between accessibility to parks/playgrounds and perceived pedestrian-environment quality. Neighborhoods with higher shares of area within the accessibility threshold recorded substantially more positive environment ratings and markedly fewer negative ratings. This suggests that even when walking for utilitarian purposes is moderated by vehicle availability and personal routines, nearby green-space opportunities can measurably improve how residents judge local walking conditions. Second, connectivity demonstrated a clear association with pedestrian-environment ratings and a weaker, less direct relationship with walking preference. In practical terms, residents appear to recognize the value of connected street networks in terms of navigability, route choice, and ease of movement, even if this recognition does not always translate into a stronger declared preference for walking over driving.
Population density also showed a meaningful association with both perception measures, but its influence should be interpreted cautiously. Higher-density neighborhoods tended to exhibit higher walking preference categories, consistent with the idea that compact environments support walking by concentrating activity and shortening effective distances. However, the findings indicate that density alone is not sufficient to explain the variability observed across neighborhoods. In medium-density areas, a considerable share of respondents remained neutral or reluctant about walking, implying that the presence of destinations, perceived comfort, and the quality of pedestrian settings may be equally or more decisive than density by itself.
Several methodological choices have implications for interpretation. The accessibility metric was intentionally constrained to parks and playgrounds and applied using a shorter distance threshold than the commonly cited one-quarter-mile standard. Given Amritsar’s reported scarcity of large parks and the uneven distribution of recreational land, a smaller threshold offered greater sensitivity to neighborhood-level differences and reduced the risk of masking deprivation by inflating accessibility through distant or boundary-external parks. The results underscore the need to revisit universal assumptions about “optimal” walking distances in contexts where neighborhood sizes, densities, and sociocultural practices differ from those assumed in much of the planning literature. Furthermore, because the study treated all parks and playgrounds equivalently, the findings point to a logical next step: separating quantity/proximity from quality and usability of green spaces, including minimum size, amenities, safety, and maintenance, which may alter how strongly accessibility predicts perceptions and behavior.
Connectivity, expressed as a normalized index, also requires careful reading. While better-connected networks were linked with more positive pedestrian-environment ratings, the planning literature cautions that excessive or poorly supervised permeability can enable antisocial behavior and reduce perceived safety. These competing effects suggest that Amritsar’s future walkability guidance would benefit from establishing a locally grounded “preferred range” of intersection density that supports route choice without compromising security and informal surveillance. In addition, the weaker association between connectivity and stated walking preference highlights an important behavioral distinction: residents may judge the environment as walkable while still choosing motorized travel for reasons unrelated to street layout, such as trip chaining, time pressure, climate, cultural norms, or comfort.
Finally, the study has limitations that restrict generalization. The design was cross-sectional, so the findings cannot establish causality. Survey sample sizes per neighborhood were intentionally modest due to time and cost constraints, and the perception instrument was brief, which may under-capture nuanced concerns such as safety, encroachment, footpath quality, and traffic stress. The categorization into broad density bands may also blur meaningful differences between neighborhoods within the same class. Moreover, only three built-environment parameters were tested, whereas walking behavior and perceptions are also shaped by social norms, personal attitudes, weather, enforcement, and micro-scale street conditions (e.g., shading, sidewalk continuity, crossing safety). Despite these constraints, the alignment observed between objective planning measures and residents’ evaluations of pedestrian-environment quality supports the utility of objective indicators for diagnosing macro-scale walkability conditions and prioritizing neighborhood-level interventions.
This study examined walkability perceptions in Amritsar by relating residents’ reported walking preference and neighborhood pedestrian-environment ratings to three objectively assessed neighborhood-planning parameters: population density, accessibility to parks/playgrounds, and street-network connectivity. Using a combination of GIS-enabled remote measurement (supported by on-ground verification) and a neighborhood-based perception survey, the analysis demonstrated that objective planning metrics can meaningfully explain variation in how residents judge local pedestrian conditions.
The findings indicate that accessibility to parks and playgrounds is the most influential predictor of perceived pedestrian-environment quality, with high-accessibility neighborhoods receiving substantially more positive ratings and fewer negative evaluations. Connectivity also relates positively to perceived pedestrian-environment quality, suggesting that navigable, well-connected street networks contribute to favorable walking conditions. Population density shows an association with both walking preference and environment ratings, but the results imply that density operates alongside, rather than in place of, destination access and network quality.
From a planning perspective, the results support a practical approach for improving walkability in Amritsar: prioritize neighborhood-scale green-space provision and equitable distribution, strengthen pedestrian-oriented connectivity while avoiding unsafe over-permeability, and interpret density policies through the lens of the destinations and pedestrian conditions that make walking attractive and feasible. Methodologically, the study reinforces the value of objective indicators for rapid, cost-effective diagnosis and for guiding the targeting of interventions, while also emphasizing the importance of complementing these metrics with deeper measurement of park quality, safety, and micro-scale pedestrian infrastructure.
Future research should extend the present work by incorporating additional built-environment variables (e.g., sidewalk continuity, crossing safety, traffic volume/speed, shading and thermal comfort), by measuring green-space quality and usability, and by employing larger samples and longitudinal designs to better evaluate causal pathways between neighborhood form, perceived walkability, and actual walking behavior.